


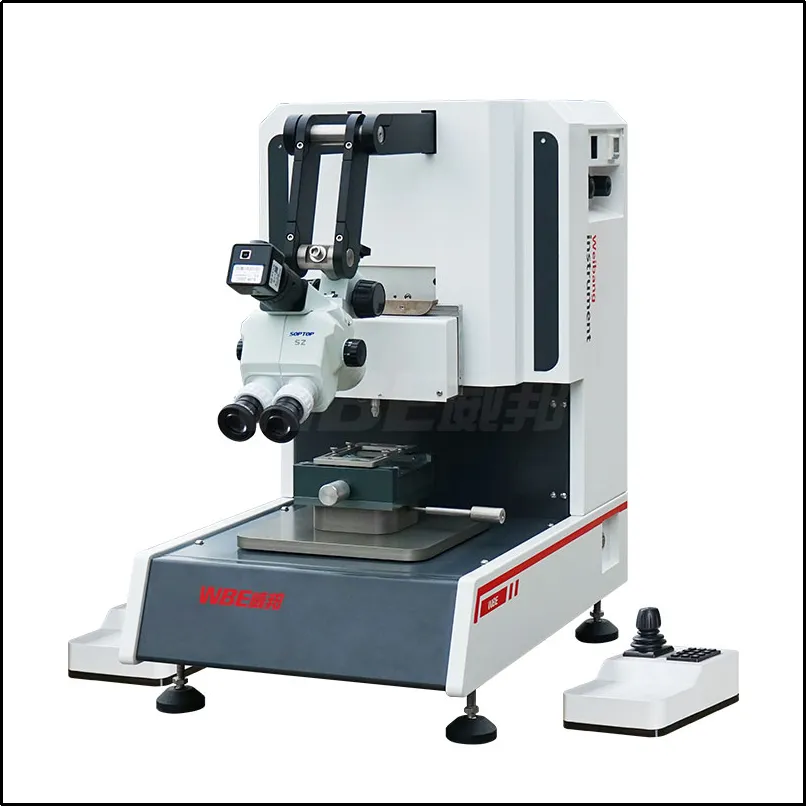
A push-pull testing machine produces a force number, and a force number on its own is a poor basis for a pass or fail decision. The same peak can come from a healthy bond, a partially peeled interface, or a tool that contacted the wrong surface, and if you only read the peak you will eventually reject good parts and accept bad ones. In the field, the difference between a useful result and a misleading one is almost always whether someone read the failure mode and the shape of the load displacement curve together, instead of trusting the number alone.
This is how we train operators and quality engineers when a bench goes into production. We will work through five steps in sequence: read the curve shape before the number, let the fracture location name the problem, rule out the four common causes of a low reading, rule out the three common causes of a high one, and finally set limits that can be defended, with a retest and a cross section closing the loop.
The short version, if you only read this far
- The curve shape separates a real weak joint from a test that went wrong. The peak value cannot.
- A break at the interface and a break in the wire neck are different engineering messages, even at the same force.
- Low readings are usually setup. High readings are usually setup too, and nobody is motivated to question them.
- A limit without an allowed list of failure modes can pass inflated results and fail honest ones.
Step 1: Read the Curve Shape Before You Read the Number
The curve explains the number. A single peak strips out every clue about how the joint behaved on the way to failure, while the shape preserves them. Four patterns cover most of what you will see on a bond bench.
- A sharp rise to a clean peak, then a sudden drop. This is the signature of a brittle interface or a brittle intermetallic break. The joint carried load elastically and failed with almost no plastic warning.
- A gradual rise with a rounded top. This points toward ductile behaviour. Something deformed before it failed, which usually means the bulk material gave way rather than the interface.
- Early noise, steps, or a flat shelf. Steps and shelves are a setup warning: tool slip, a specimen that shifted in the clamp, or a lead that bent before the load reached the joint.
- A peak immediately at the start of the run. A very early peak normally means the tool touched something it should not have, or the specimen was already loaded before the test began. Treat it as a setup error, not a bond result.
The practical value of curve shape is that it separates a genuinely weak joint from a test that went wrong. Over the years we have saved more parts by reading curves than by reading numbers, because the curve is where the setup leaves its fingerprints. Once you can recognise those four patterns, the next question is what the fracture location itself is telling you, and that message is even more specific.
Step 2: Let the Fracture Location Name the Problem
Bonds fail in four recognisable places, and each one points at a different root cause. Learning to separate them is the single highest value skill on a bond test bench, because two of the four tell you about the joint while the other two do not.
| Fracture location | What you see | Usual root cause | Engineering message |
|---|---|---|---|
| Interface separation, peel | A clean lift off with one surface left bare | Weak adhesion, contamination, poor surface preparation | The joint never formed properly |
| Bulk fracture in the solder or bond | Material torn through the body of the joint | The joint formed well, but the alloy or solder is weak | Bonding worked; material strength is the limit |
| Intermetallic layer fracture | A brittle break inside the reacted zone | Excess intermetallic growth driven by thermal history | A time and temperature problem, not a placement problem |
| Neck or shank break | A break away from the joint, in the wire or lead | Tool loading point, loop geometry, or handling damage | The test was the weak point, not the bond |
A bulk fracture is often a good sign, because it means the interface held while the material gave way. A neck break tells you almost nothing about the joint, because the load path failed somewhere the test was never designed to probe. Before you record any force, classify the break. If you cannot say where the joint failed, you do not yet have a result you can act on. What usually stops people from classifying is not the microscope work, it is not knowing which causes to look for, and the low readings are the place to start.
Step 3: Four Reasons a Value Comes In Abnormally Low
A low reading is not automatically a bad bond. Before you scrap a batch, rule out the setup, because a low value has several innocent explanations and only one serious one. In our experience the setup explanations are more common than most teams expect.
- Tool contact and gripping. A hook that only partly engages a loop, or a shear blade set at the wrong standoff height, under reads badly. Check the tool position before you blame the joint.
- Alignment and eccentricity. An off centre load introduces a bending component, and the joint fails earlier than it would under a pure load. This is one of the most common hidden causes of a low but repeatable value.
- Specimen preparation. Residue, an unfinished cure, or handling damage that happened before the test can all weaken a joint without the process being at fault.
- Test speed. Running faster than the method calls for shifts the result and adds dynamic noise to the peak, which makes a sound joint look marginal on paper.
When all four are excluded and the curve still shows a clean brittle break, the low value is real, and at that point the conversation moves to the process rather than the bench. We keep one rule that stays honest in both directions: never reject a batch on the first low set of numbers. Re-check the tool, re-seat and re-run a few parts, and look at the curve before you look at the limit. Rejecting good parts is expensive, and it usually starts with a setup nobody questioned. The same suspicion has to run in the other direction too, because a high reading is the more dangerous anomaly.
Step 4: Three Reasons a Value Comes In Abnormally High
A high reading flatters the process, so nobody is motivated to question it. That is exactly why it deserves attention, because accepting an inflated number is how a bad bond escapes into production and comes back from the field.
- Test speed set too high. A fast rate raises the apparent peak on many solders and bond interfaces, and it also adds dynamic content to the signal. The number rises without the joint being any stronger.
- The wrong hook or push tool. A hook that is too large bridges the loop instead of lifting it, and a push tool with the wrong tip shape contacts a shoulder rather than the feature. Both produce a genuine force that describes the tool, not the bond.
- Measuring a structure that is not the target. If the tool hits the substrate or the package body, if underfill or encapsulant braces the joint, or if the break happens away from the joint in a strong shank, the peak is real but it is answering a different question.
When we commission a bench we deliberately hunt for false highs first, because they are the failures that pass inspection and then return from the field. A quick tool contact check, a curve review and a look at where the break actually happened will usually expose them within a few specimens. Repeat push work makes this even more important: in solder ball repeated push fatigue, or a BGA matrix pushed joint by joint, a single high reading at one position often means the tool indexed onto the substrate rather than onto the ball. The LED package bonding push pull testing machine configuration is a good example of a bench where index position and tool geometry have to be locked down before any number is trustworthy. With both directions of anomaly understood, you can finally decide where the limit belongs.
Step 5: Set Limits, Retest, and Close the Loop With a Cross Section
Limits should be derived from failure mode data, not imposed on it. A single minimum force with no mode requirement invites both errors at once: it can pass a batch whose numbers were inflated by tool contact, and it can fail a batch whose lower numbers came from a shank break. Use three parts instead of one.
- A minimum force, established by testing known good and known bad material rather than by copying a figure from another product family.
- An allowed list of failure modes, so a result is only acceptable if it also broke in an acceptable place.
- A written rule for results that satisfy one part and not the other, which should send the batch to investigation rather than straight to pass or fail.
The same logic scales across package types, but the thresholds do not travel. A chip shearing push pull testing machine setup on a small die will show a different mode distribution from a large panel bench, because the geometry and the materials are different. Copying a limit from one application to another without re-deriving it is a common and entirely avoidable mistake. Large substrates and long interconnects add a reach problem on top of it, which is where a PCB large sample bond tester or a large stroke push and pull testing machine usually appears, because the right measurement is only right if the tool can physically reach the joint in the correct orientation.
When a result is genuinely ambiguous, do not force it into a pass or a fail. Retest under controlled conditions, then confirm the interpretation with a cross section. This is the sequence we recommend to every customer who has to defend results to a third party.
- Re-inspect the tool for wear, clean the contact surfaces, and confirm the standoff or engagement position.
- Re-run a small set on fresh parts at the speed the method specifies, logging the full curve for each specimen.
- Classify the mode for the retest set and compare the mode distribution, not just the mean force.
- Section a representative sample and examine the joint under magnification, so the mode assignment is confirmed by observation rather than assumed from the curve.
- Record the confirmed modes in the test record and feed them back into the limit definitions.
A section is worth the cost whenever a limit is new, whenever a batch sits within a few percent of the threshold, and whenever the mode assignment from the curve would change the verdict. Above that level, the aim is consistency across benches and shifts, so the same curve logic and the same mode codes apply whether the part is a wire bond, a die or a package ball. Many teams settle on one platform family so the interpretation rules travel with the tooling, and the workflows we describe on our testing solutions page are built around exactly that pass of the loop, from semiconductor packaging through optical communication device packaging, LED packaging and military device failure analysis. The wider picture of how these benches sit inside a packaging line is covered on our semiconductor application page.
Frequently Asked Questions About Push-Pull Testing Machine Results
Is a bulk fracture a good or a bad result?
Usually it is a good sign, because it means the interface held while the material itself gave way. It becomes a problem only when the specification expects a particular failure mode, or when the bulk strength is itself below the requirement. Record it as its own mode rather than lumping it in with interface failures.
How many parts should I retest before trusting a result?
There is no universal number, but the retest should be large enough to show whether the mode distribution changed, not just whether the mean moved. In practice a small, deliberately chosen set on fresh parts, with the tool verified first, normally tells you whether the original result was a setup artefact.
Can software classify the failure mode for me?
Software can log the curve and prompt for a mode, and automated curve analysis is a useful consistency check, but the classification itself still needs a person or a microscope. It should support the operator's judgement rather than replace it, especially on borderline cases where the difference between two modes decides a pass or a fail.
Why do my results drift between shifts?
Shift to shift drift usually traces back to setup habits rather than the machine: a differently seated specimen, a tool left at the previous recipe's height, or a zero set with a preload already applied. Standardising the setup and logging the mode for every part normally exposes the source within a few days.
Reading failure modes is what separates a push-pull testing machine that produces data from one that produces decisions. Classify the break, read the curve before the number, question the flattering high results as hard as the low ones, and confirm your interpretation with a cross section when it matters. Do that consistently and you will stop rejecting good bonds and stop letting the bad ones through, which is the only outcome that actually protects the product.
Judge the break, not just the peak
Review benches that log the full load displacement curve and record a failure mode with every result, so each decision on a push-pull testing machine stands on evidence rather than on a single number.
See curve logging bond testers Send a few load displacement curves